![]()
I chose immigration because the stories of immigrants have always inspired me. I think of my ancestors, whether they arrived at Plymouth in 1650 or Ellis Island in the 1920s, and the bravery it took for them to sail across the Atlantic to a new country. The United States is a country of immigrants, and many Americans have a story of an ancestor who took great risks to come. By studying the immigrants of Harrisburg, even at a macro-level, I am learning about their stories and I feel like I am bringing their struggles and bravery to life again.
To learn more about the immigrants in Harrisburg and to see how they changed over time, I used Microsoft Access to compare the census records from 1900 to 1930. Microsoft Access allows for the user to comb through data quickly by asking the system specific questions using queries. Access takes some time to get used to, but is more powerful than Excel when actually processing the data. Unlike Microsoft Excel, you cannot add to spreadsheets in Access. Instead, you must import them from Excel. So to begin I imported the census records to Access, where I asked questions about the immigrants of Harrisburg.
Data can say a lot about how people lived, even if it takes some interpretation and focus to notice the patterns. For example, I looked at gender ratio within immigrant groups. I examined the Italians and the Russians. In 1900, there were far more Italian men in the city than women, about a 4:1 ratio. The Russians though had an almost even ratio. While it may not be obvious, the reason why there were so many male Italians was because they were here for jobs. Like many immigrants today, the Italians in 1900 Harrisburg came to America (where there are higher-paying jobs) to make money and send it home to their families in Italy. Often they would only stay a few years and return, or they would intermarry or even bring their families to America later on. Harrisburg was a center for industry, particularly railroad and steel (Beers 111, 115). On the other hand, the Russians came in families. Many were not coming for economic reasons, but social ones. Many of the Russians in Harrisburg were Jewish, as seen by language being either Hebrew or Yiddish, and they were escaping persecution in their home countries. By 1930, the Italian ratio reduces, now only 3 males to every 2 females. This means that more Italian families were arriving with wives and children, but several single men were still there. The Russian ratio remained the same in 1930 as it was in 1900, showing that families remained in Harrisburg.
Some pieces of data are more difficult to interpret than others. In 1930, there were zero people under 18 who are Russian-born in Harrisburg.
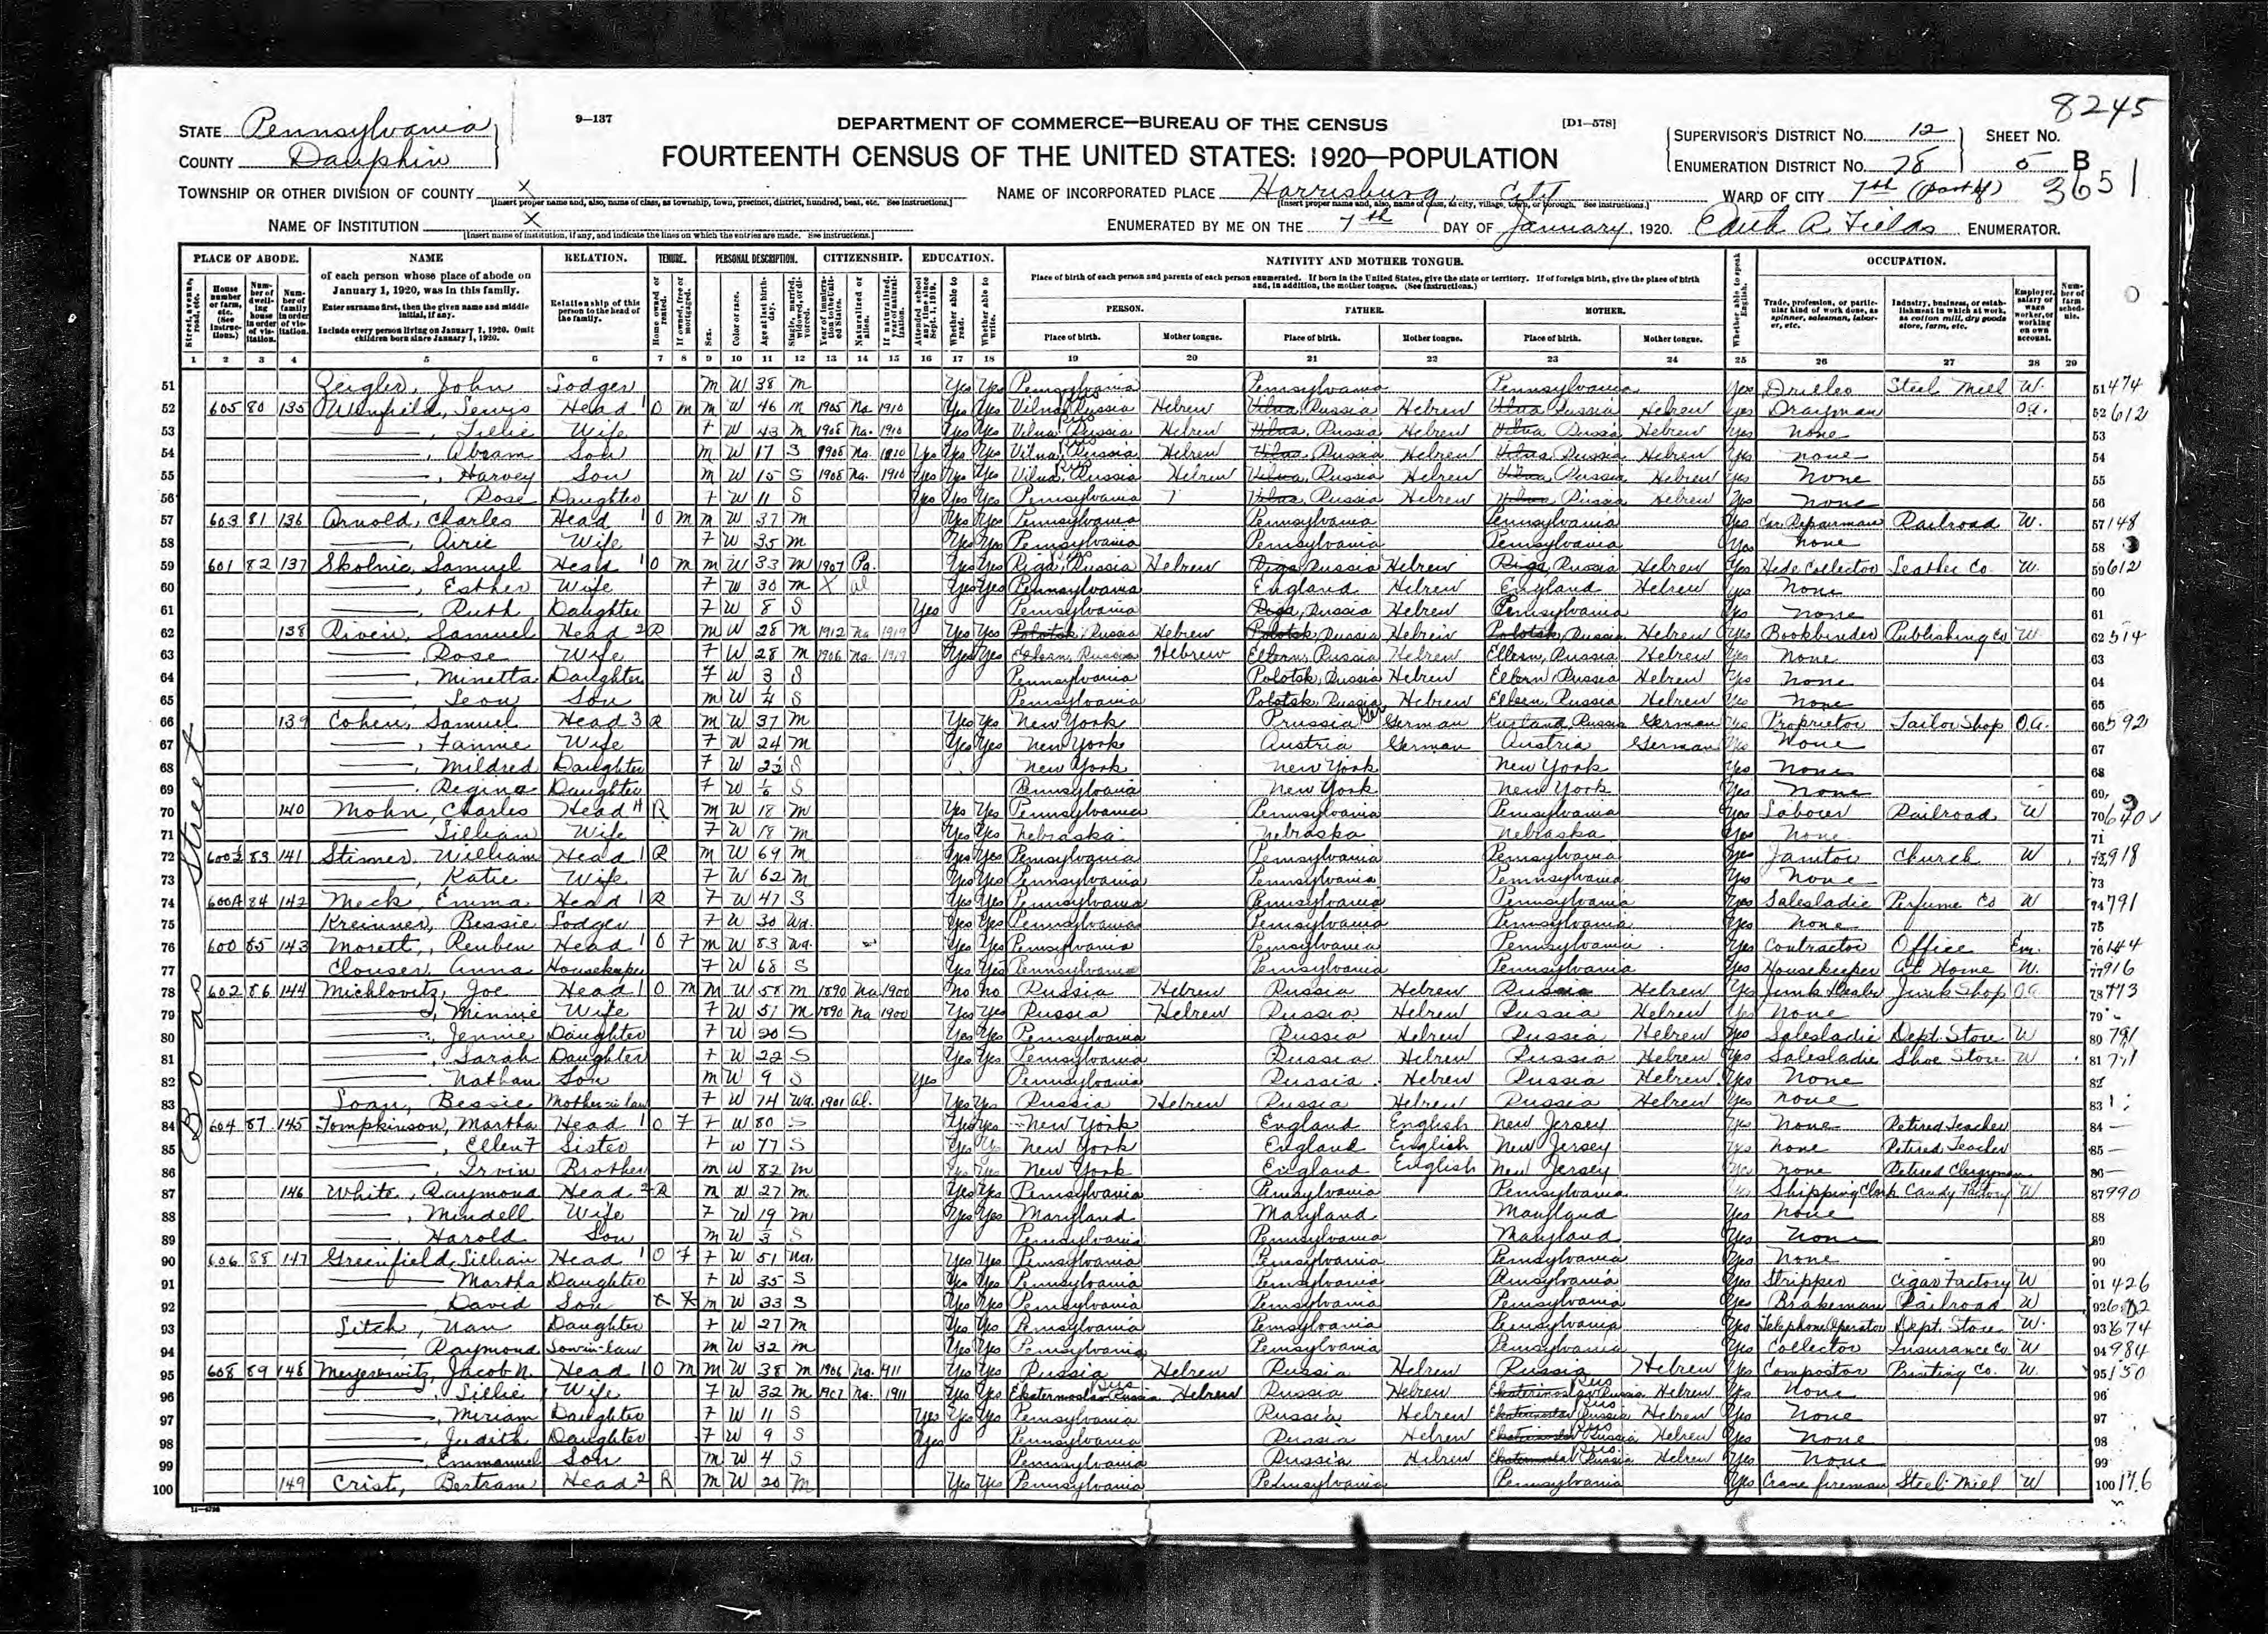
Source: Ancestry
This query would make any researcher wonder. If the Russians were coming in families, then why were there no children? Also, their population is still large in Harrisburg…Did they stop having children? After some thought, I realized that the Russian immigrants were still having children, but their offspring were born in the United States. This figure demonstrates the slowing down of immigrants from Russia to America during and after World War I and the Russian Revolution.
My love of genealogy and data helped me to take great joy in completing research on the immigrants in Harrisburg. I appreciate the numbers of history, giving straightforward facts that allow for wider interpretation. I hope to follow a career that allows me to look into the data side of history with great depth.
