
Understanding the City Beautiful movement involves understanding change. The actual definition of change from Merriam Webster is “to make different in some particular.” This definition does not encompass the whole reality of change. To change from one thing to another always involves losing something. Sometimes this is losing something bad and gaining something good, but there is always give and take involved in change. As the saying goes, nothing comes from nothing. Something must have existed for a change to happen to it.
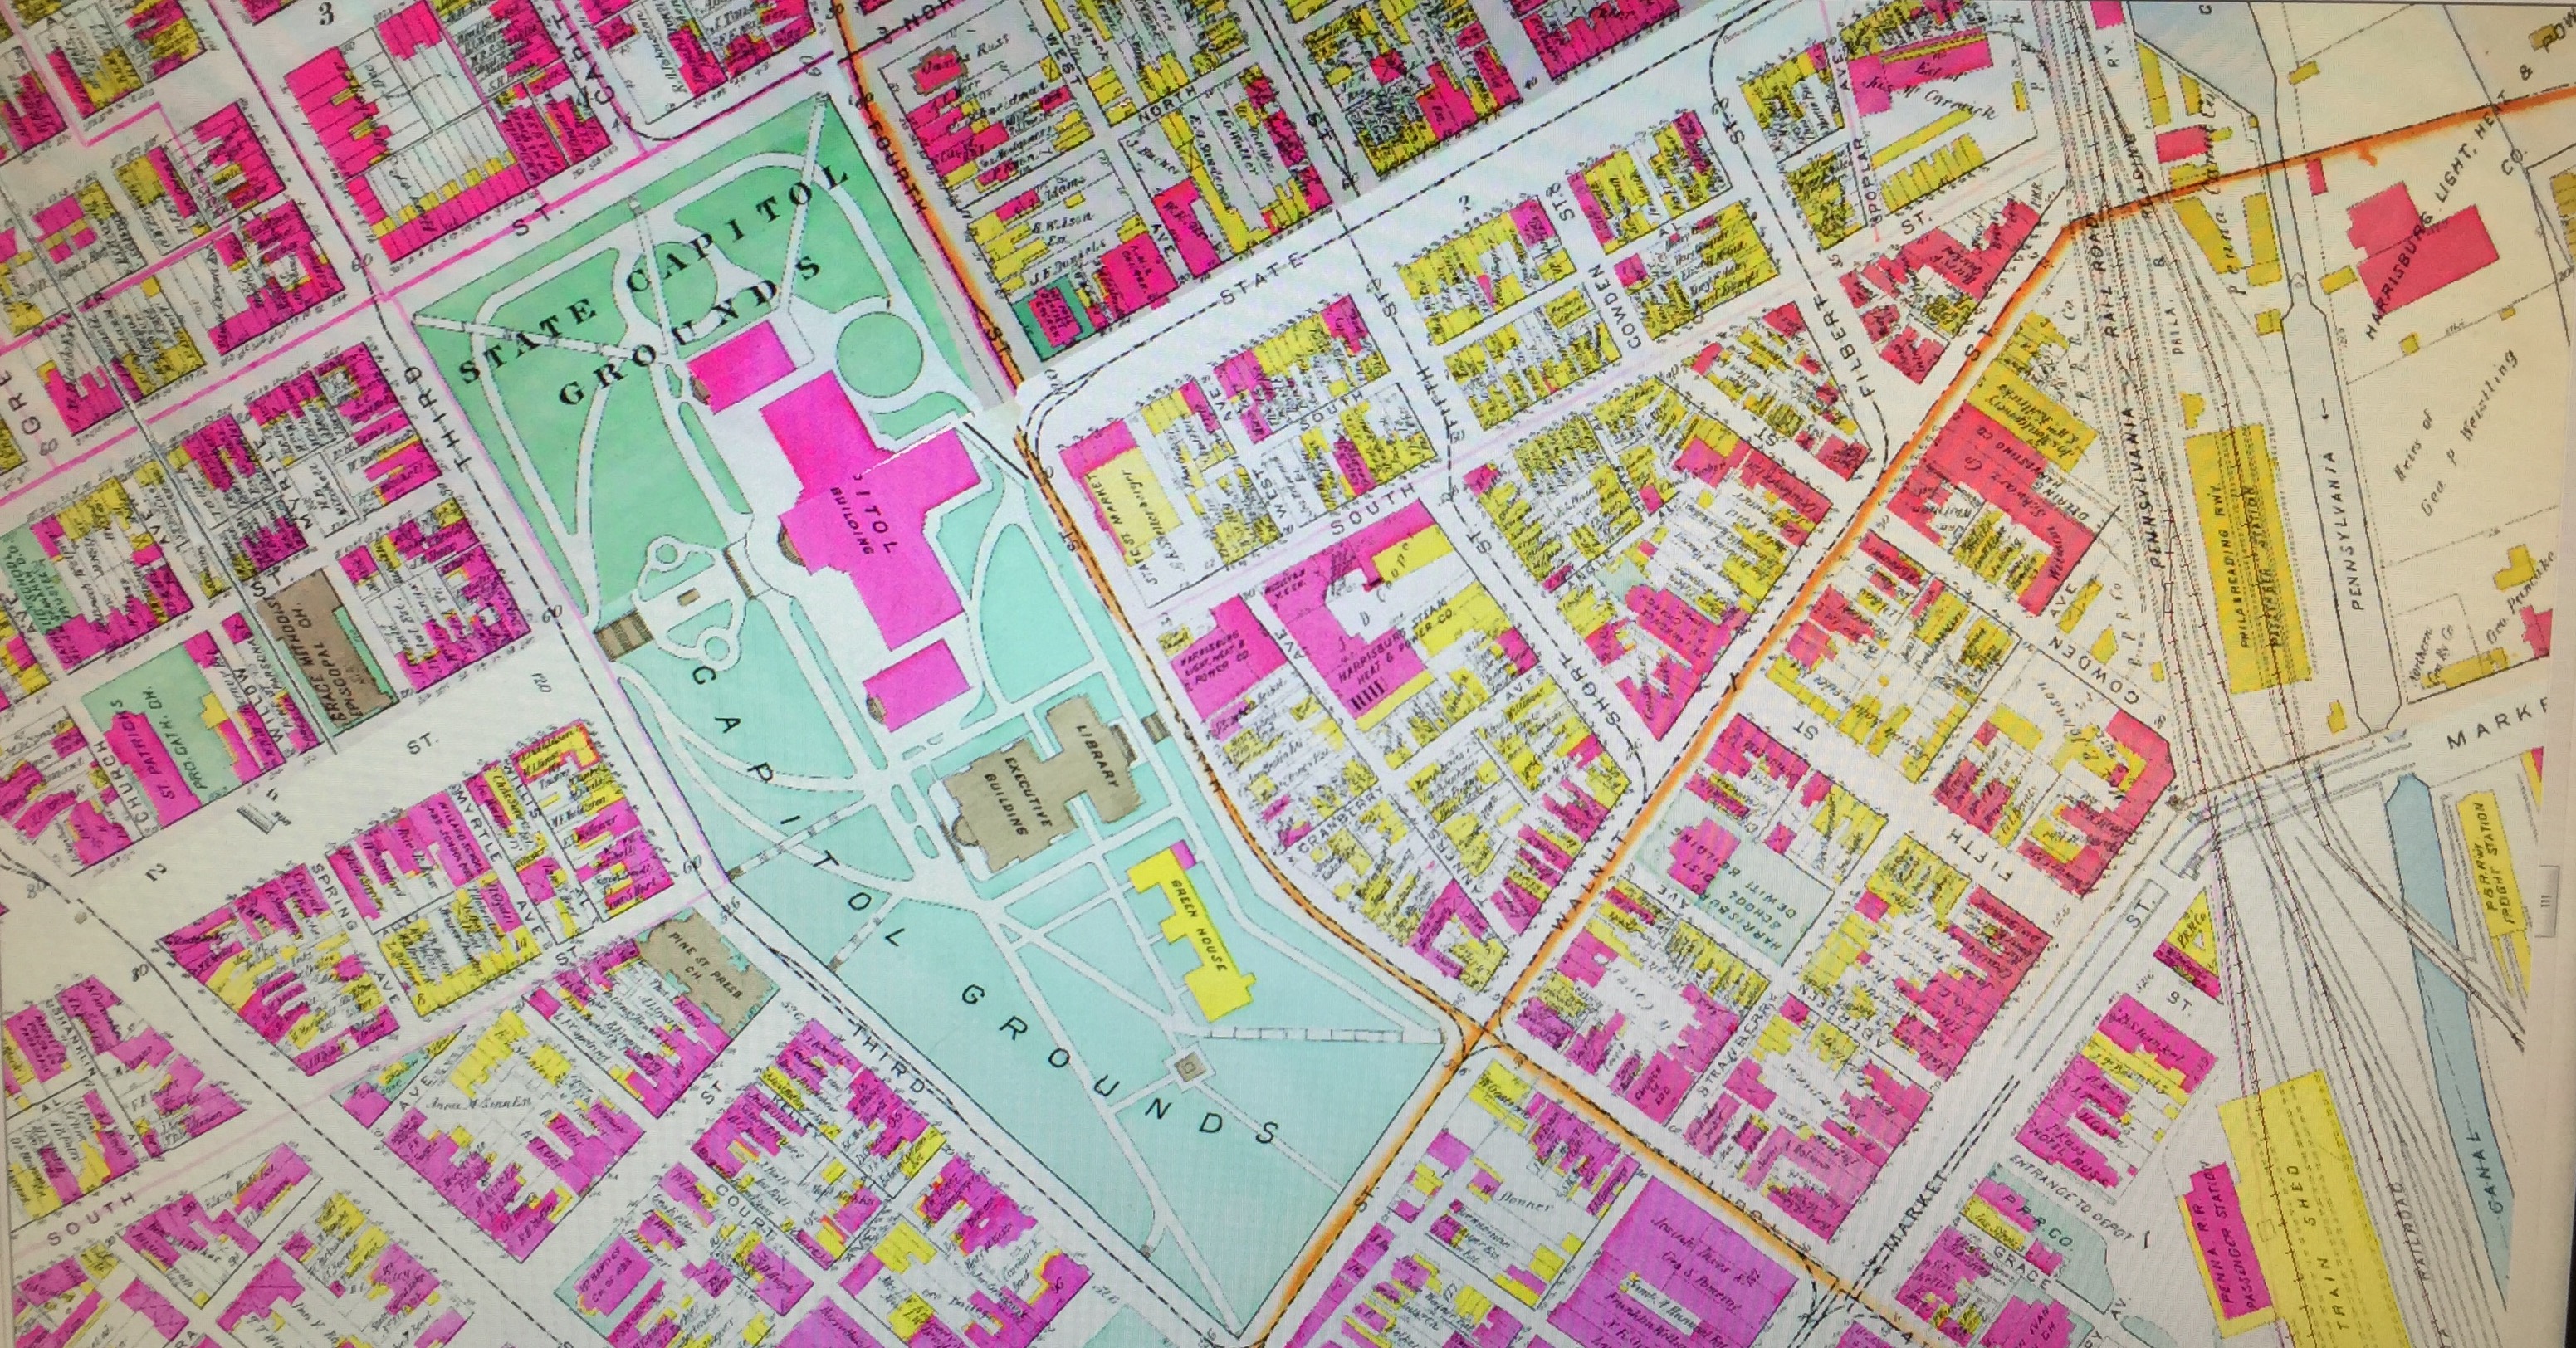
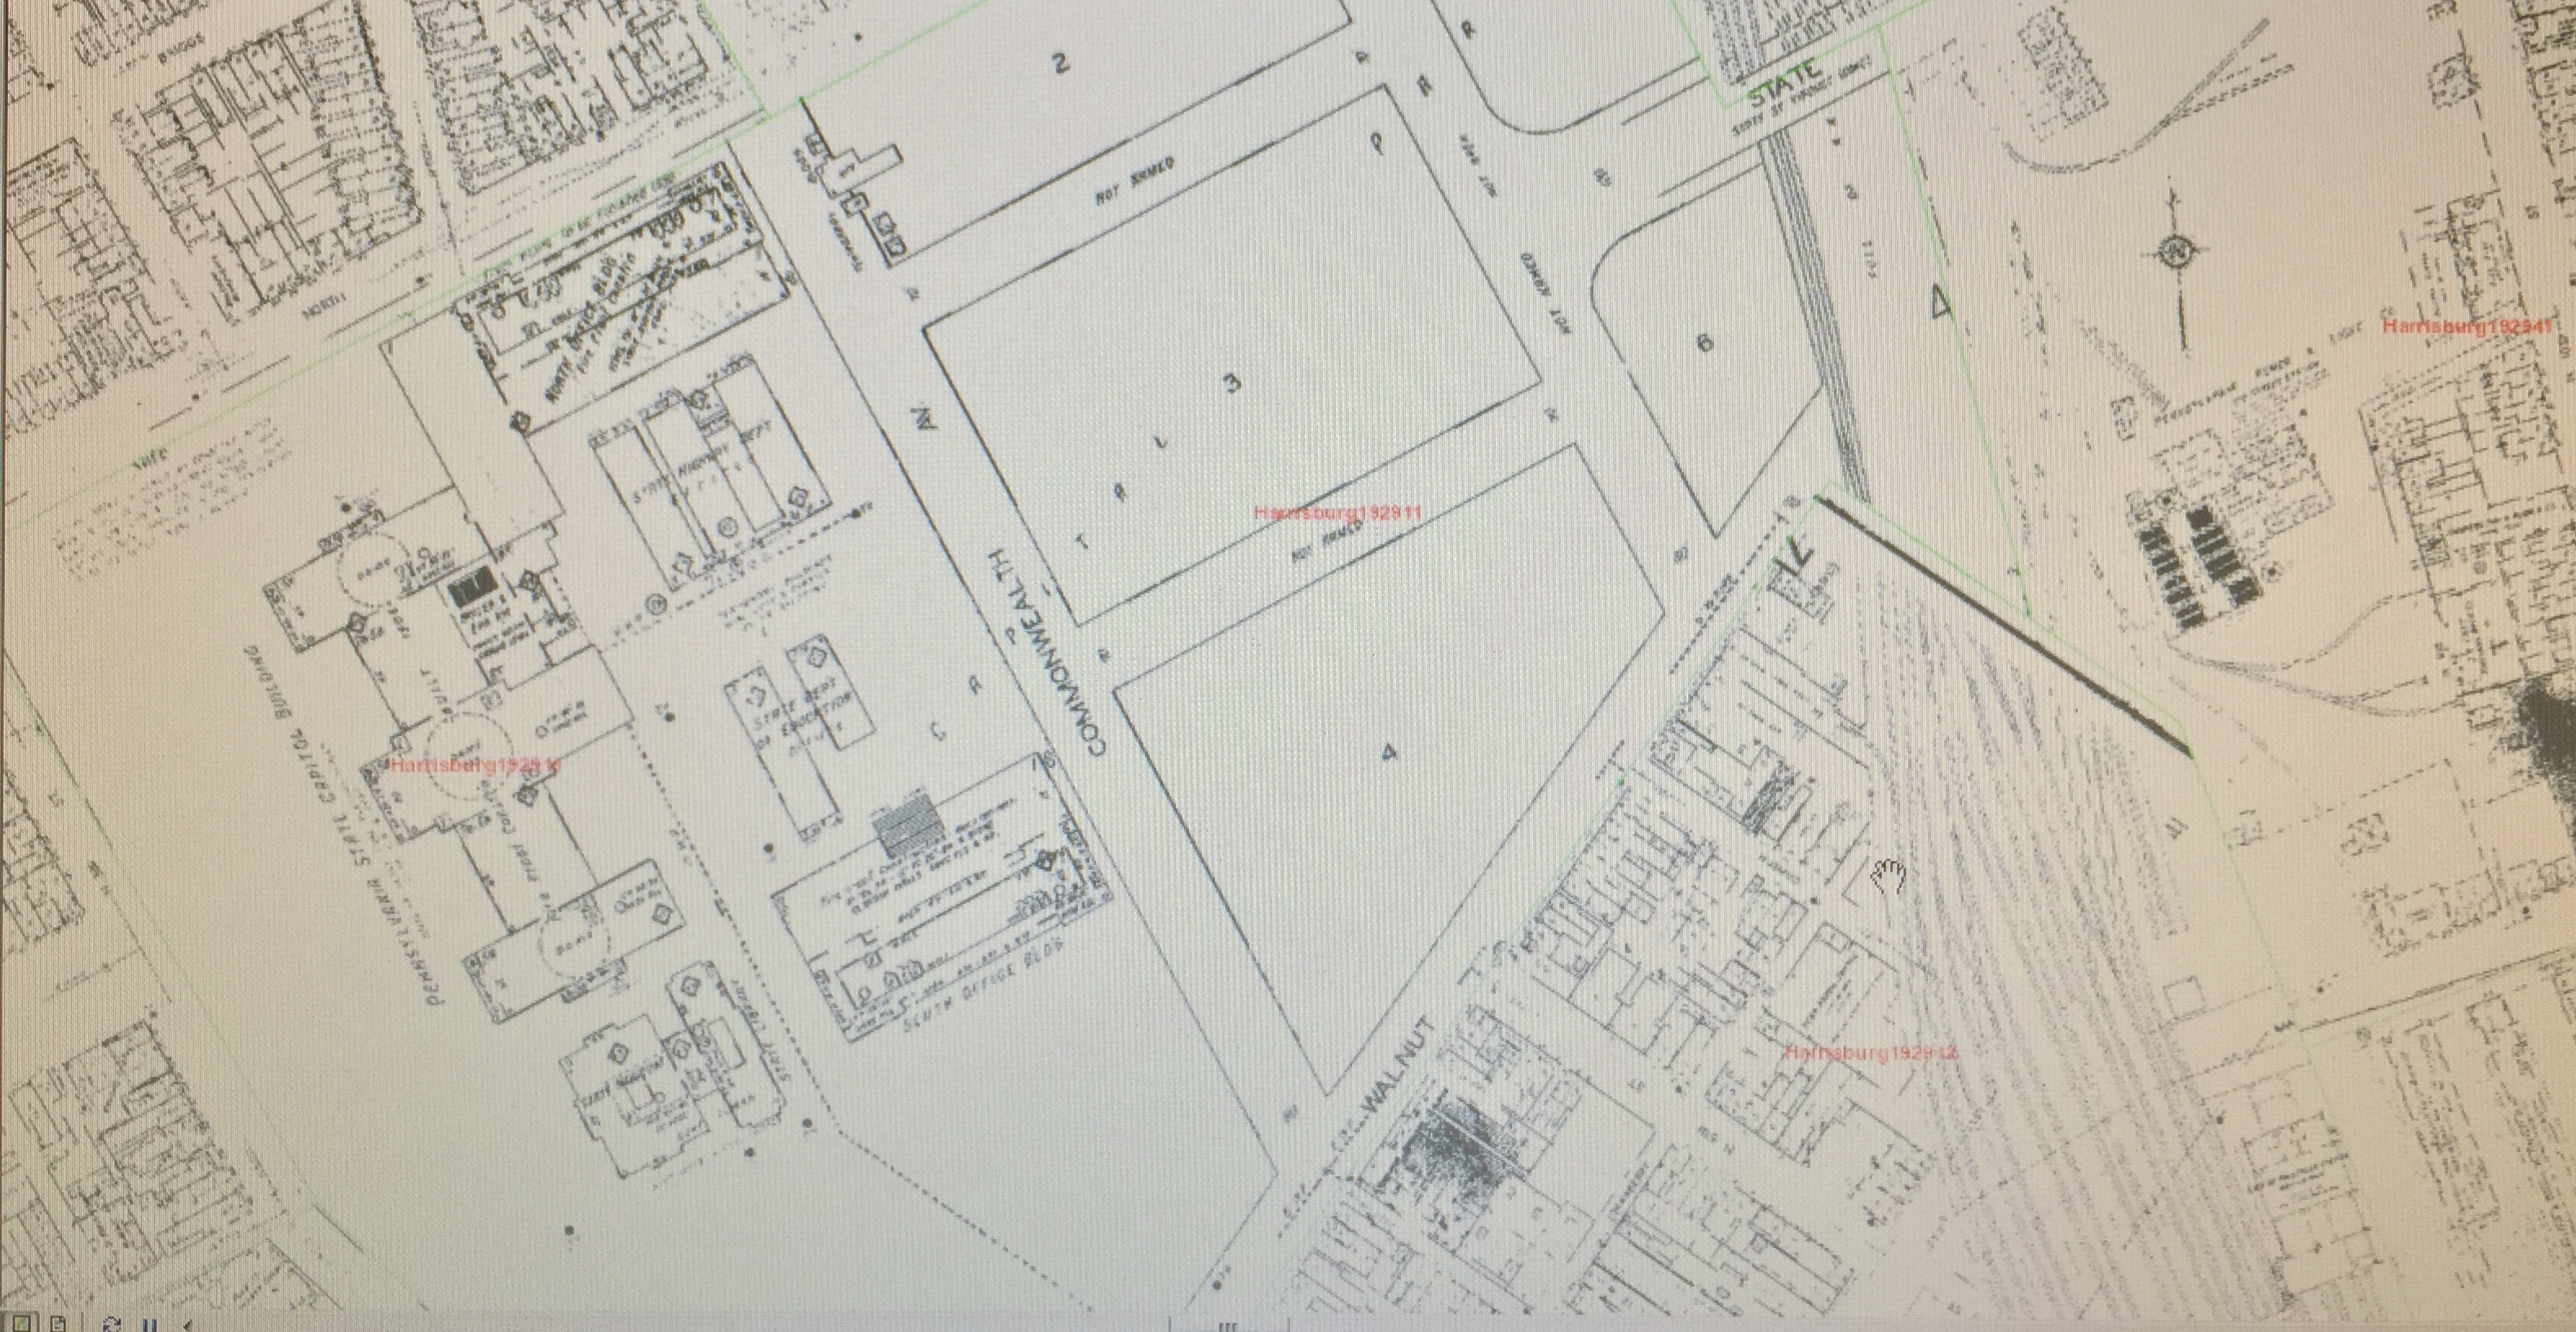
So it is with Harrisburg before and after the City Beautiful movement. Many changes were made, which were usually viewed as improvements. The other side of the coin, though, is what those “improvements” replaced. A prime example is the Capitol complex. The Capitol was destroyed by fire in 1897 and was rebuilt as a large complex in 1919. This seems to be all good so far, correct? Well, if you look at a map of the area around the Capitol before the reconstruction of the building and after the reconstruction, you can see what was destroyed. A whole neighborhood named the Eighth Ward was demolished at the cost of rebuilding and expanding the Capitol. Beers writes about this in City Contented, City Discontented, explaining that 598 buildings were razed to make space for the complex.
Another aspect of change involving the Harrisburg City Beautiful Movement is the status of women in the city during that time. Their status changed in relation to their literacy. In addition, their opportunities outside the home grew over 30 years, although not as much as we might expect or hope. This is important to note because, at a time when supposed improvements were happening all around the city, not much of that progress was put towards the status of women. Taking a look at the census reports of Harrisburg from 1900 to 1930 also lends a deeper understanding of the atmosphere at the time of the City Beautiful Movement. I accessed this data from the Digital Harrisburg’s digitization project involving the census information from Harrisburg in 1900-1930. According to the data in the census, which we must keep in mind can be inaccurate in some cases, the world was opening up, little by little, to women. In 1900, 83% of the white women over 18 in Harrisburg could read. 67% of African American women over 18 could read. In 1930, those percentages jumped to 98% and 93%, respectively. This is a huge jump in the span of just thirty years. The women’s role in Harrisburg during that whole period was still primarily in the home though. In 1900, 78% of white women over 18 don’t have an occupation listed. In 1900, 64% of black women over 18 don’t have an occupation listed. In 1930, the percentages were 70% & 51%, respectively.
The tools I used to find this data were the tools we learned about in class this week. We reviewed how to use the basics of Microsoft Excel and then learned how to work with Access. I had never heard of Access before but now I have many new tools for analyzing data. We also covered how to make Story Maps on esri.com and also about general topics regarding GIS. When using GIS to practice history, there is a certain dichotomy at play.
On the one side, because GIS was not created with the aim of being used by historians, there are some unique challenges with using it. Karen Kemp talks about this in her chapter of the book, The Spatial Humanities: GIS and the Future of Humanities Scholarship. One small example of a problem is the specificity required for mapping with GIS. When mapping historical events, it is not always possible to get an exact coordinate of where an event took place. She offers a solution to this struggle by telling the reader to keep in mind the margin of error and to analyze the sources of the data to minimize error as much as possible.
On the other side, we must also be cognizant of the fact that there are many opportunities for humanists to use GIS. Knowles and Hillier cover this in their chapters on GIS and History and teaching with GIS. Two benefits of teaching GIS are aiding students in their problem-solving skills and analytical thinking skills. They also explain that using GIS teaches visualization tools and political and social awareness. Using GIS can allow you to ask new questions with the data in front of you.
Using Excel, Access, and GIS this week has challenged me in technological skills and also broadened my understanding of what you can do with data.
