
As a student of history, I have heard the words “change” and “continuity” on numerous occasions. Whether it is a class on Modern American History, Premodern Civilizations of Asia, Ancient Rome, 16th century Germany, or Medieval Europe, these two terms have an inherent role in the semester-long courses.
This understanding has shaped my perception of the world around me. Places, the people in those places, and the cultural traditions that they uphold are both similar and different from those before them. It would be too simple to say that “times have changed” or that “we’re stuck in a rut,” because to a certain degree both statements are probably true.

In the city of Harrisburg, change and continuity are evident. During the first third of the 20th century, the City Beautiful Movement transformed the industrialized area. In my last post, I described how my fellow Digital History classmates and I put together exhibits about this movement. We went to two different Harrisburg archives, the State and County Archives, to gather research for our Omeka sites. From this experience, we learned how much Harrisburg changed over the course of a few decades.
After organizing our collections of photographs, lantern slides, newspaper articles and more in Omeka, we moved onto a new form of presenting information. If you have access to Harrisburg Census records, how do you turn all of that raw data into coherent information for publication? One aptly named database management system, Microsoft Access, lets the user organize and analyze massive amounts of information. This is especially helpful if you are working with a data set like the 1900 population of Harrisburg (which includes 50,168 individuals). Though it may take some getting used to and plenty of trial and error, the query function of this program is extremely useful in learning more about Harrisburg.
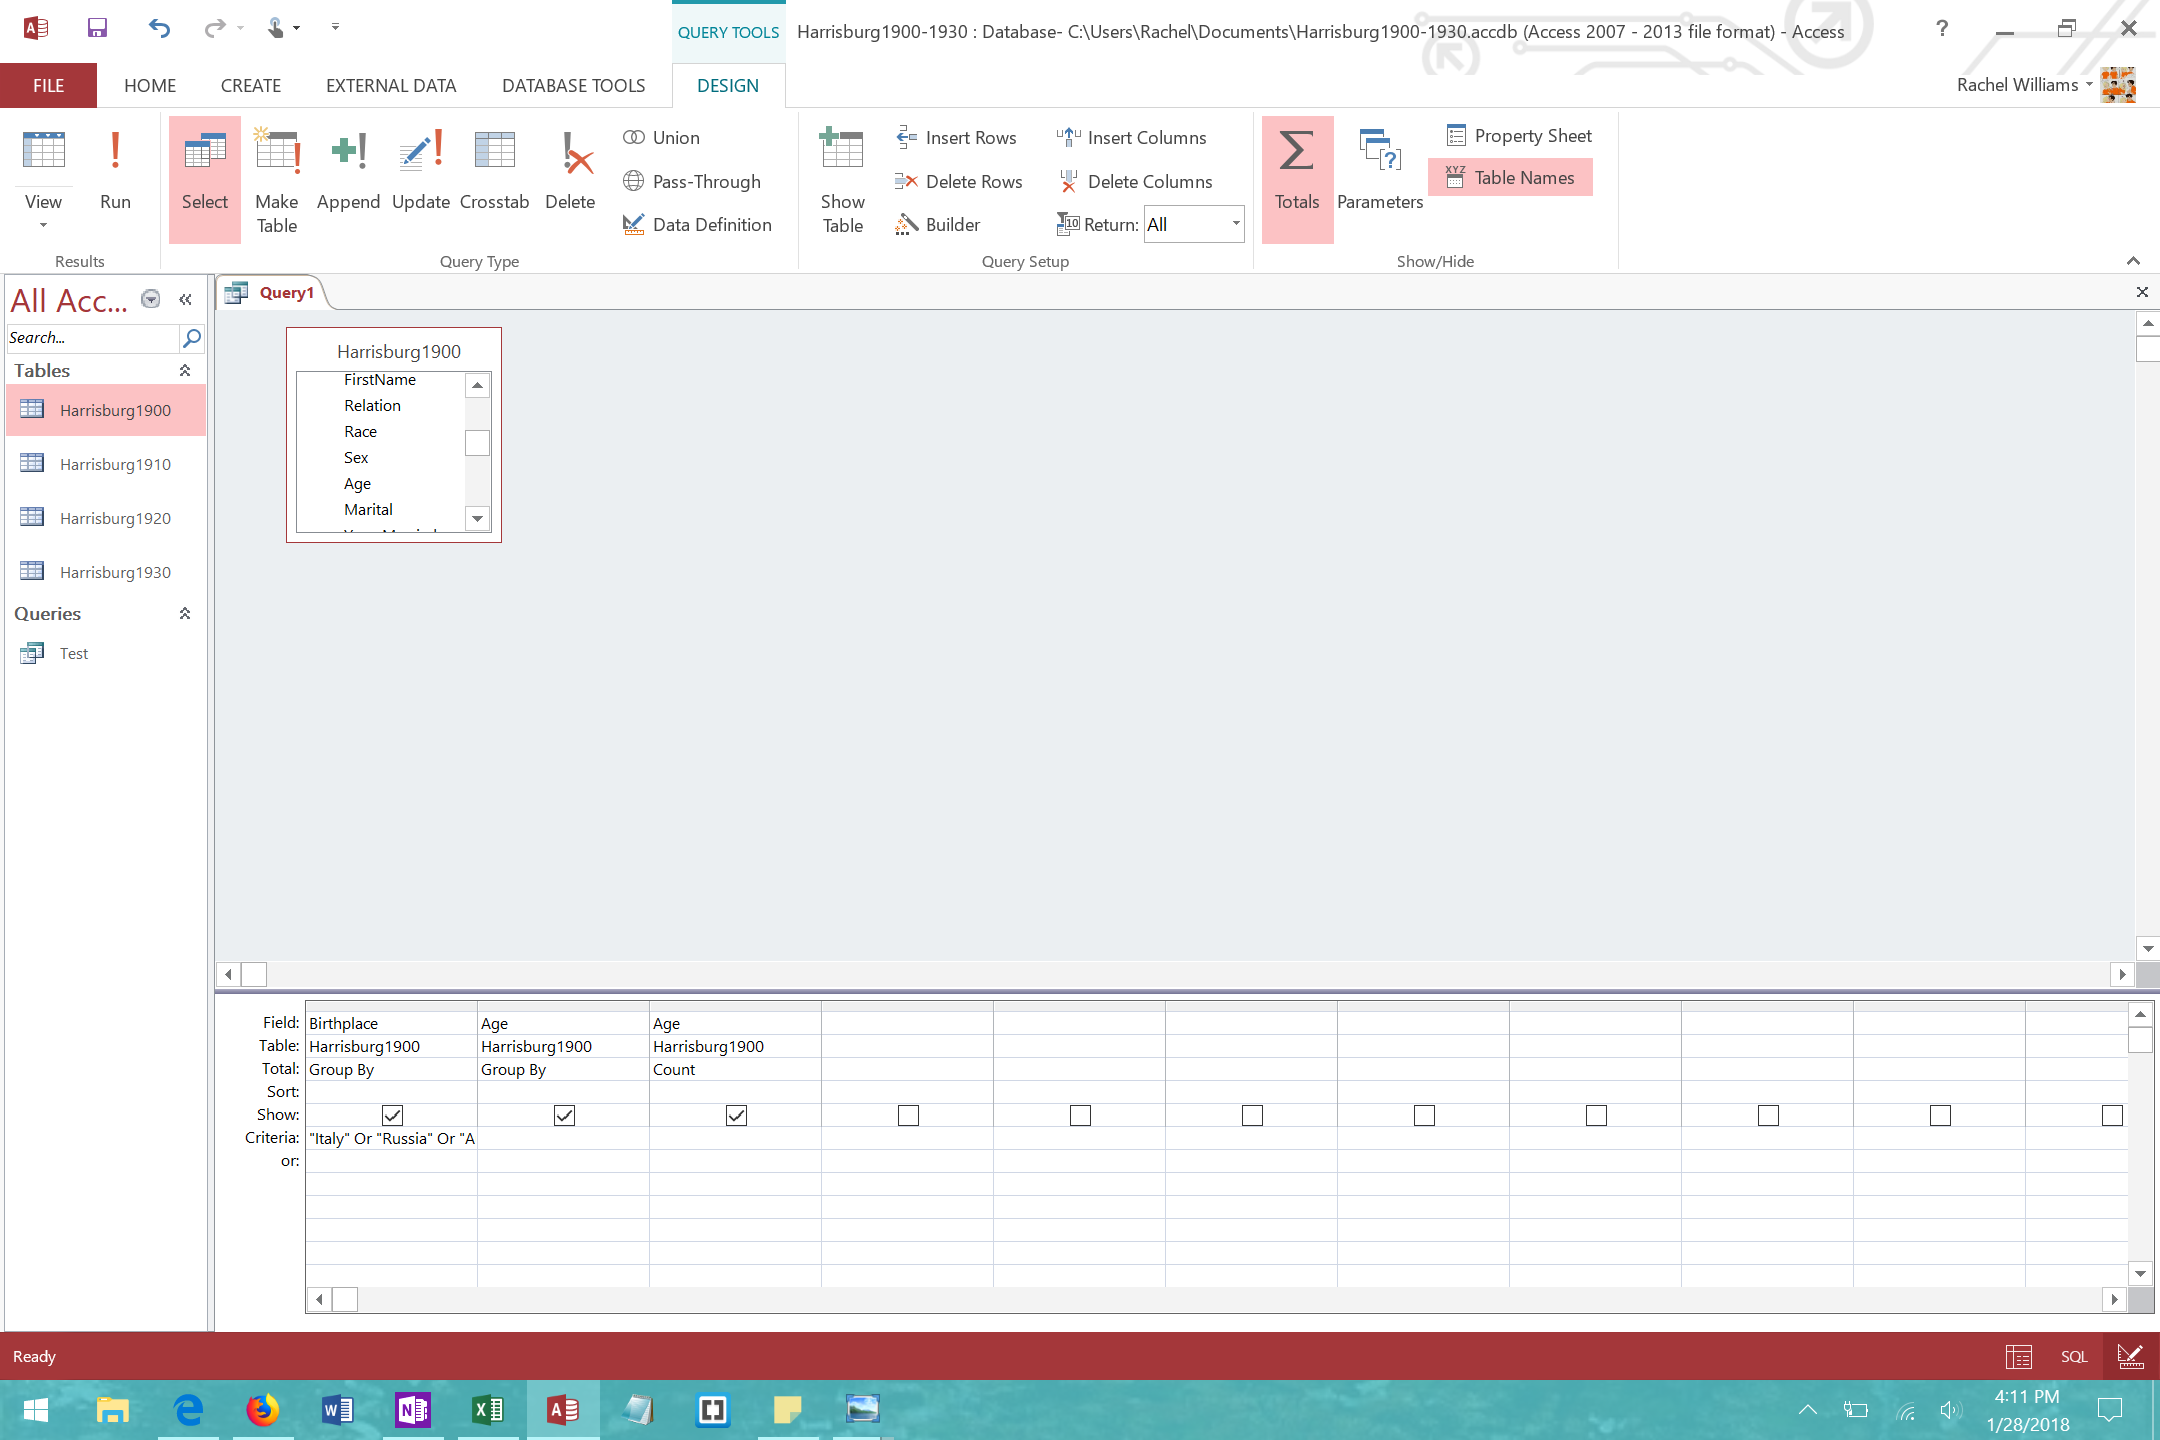


Also, under the “External Data” tab, Access allows users to import and export files from Excel, another Microsoft program useful for interpreting and arranging information. We used different formulas like AVERAGE (for finding the average age of a range of individuals), SUM (for finding the total of a selected range), COUNTIF (for determining how many of a certain qualifier are within a chosen range), and more to learn additional information from large amounts of numbers and text.
Using these resources, it was easy to spot certain trends in Harrisburg between the years 1900 and 1930. In 1900, the largest immigrant group was German, but by 1930 the Italians held that title. In 1900, 80% of the Italian immigrants were male, so only 20% were female. However, thirty years later, the percentages had somewhat equalized to be 61% male and 39% female. In the first year of the century, 18% of the Italian immigrants of Harrisburg were boarders.
If someone wanted to delve into an extensive immigrant population project, they could pinpoint every Italian immigrant in Harrisburg on an ArcGIS map and add in their queried information. Toni Weller, author of History in the Digital Age, describes how spatial analysis and geohistory can relate different types of data based on their shared location. Therefore, after completing such analytic work, an individual could produce a 1900 Harrisburg map with clickable houses full of loads of information about the tenants. In this way, as David Bodenhamer states in his book The Spatial Humanities: GIS and the Future of Humanities Scholarship, a person is bridging the precision and qualitative nature of science with the imprecise subjectivity of social science. With the two of these together, you can craft a numerically and personally representative model using an engaging medium of visual display.

Other than a Harrisburg immigrant study, one could also select several houses in the city and trace them through consecutive decades using the same databases. A project like this has an added element of closeness with the past since you are following the same location throughout the years. If the occupants remain the same, then you are following their lives too. Since the Census records come once a decade, looking through multiple records is like opening a doorway and peeping into a family’s life every once and a while like a guardian angel. Of course, we cannot actually meet the people behind the names, but we can still feel some form of connection with them due to the detailed records.
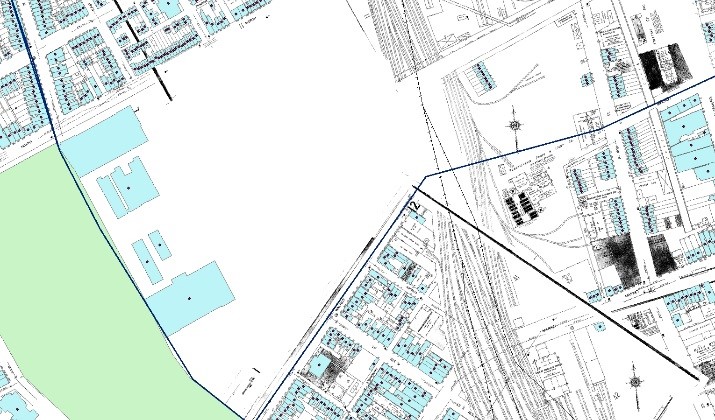
Through my research, it was clear that Harrisburg went through much change and continuity between 1900 and 1930. Of the three houses that I chose, all were in or near the 8th ward. 600 State Street was a few blocks behind the old Capitol, 111 Evergreen Street was on the outskirts of the 8th ward down closer to the 2nd ward, and 1618 Walnut extended back into the newer developments of the 8th ward farthest from the Susquehanna. As expected, the house at State Street no longer existed by 1920 since the Capitol Park construction demolished many streets directly behind the Capitol building. The houses at Evergreen and Walnut existed for all thirty years, but the ownership did not stay the same. Most consisted of boarders, immigrants, and single individuals, and the records varied greatly from year to year. In only one case did a family stay in their home for more than a decade, and by 1930 they had left anyway. I wonder what led these people to move so frequently.
With the spatial humanities, so much is possible. As Weller wisely states, there is a level of inaccuracy and incompleteness in everything, but spatial projects nevertheless have the potential to exhibit great patterns of continuity and change.
Caption for featured image:
Top left: 1830; Top middle: 1861; Top right: 1882
Bottom left: 1892; Bottom middle 1901; Bottom right: 2018
