
 During our last few Digital History class periods, we’ve gained an introduction to GIS (geographic information system). I’m familiar with the basics of GIS from my internship this summer. I worked for the Bureau for Historic Preservation, in the CRGIS (sculptural resources geographic information system) Office, but I really only used a program call GeoMedia. I am not overly familiar with ArcGIS, which is the software we’ve been exploring in class, so I was grateful for the chance to work a bit with the program. We learned how to line up a historic map of Harrisburg with a modern map and how to add base-maps and external information.
Our assignment for this week was to choose a specific group of people and consider their spatial representation on a map of Harrisburg. Some of my classmates chose to work with the people they will be studying for our final project, while I chose the group of people I  used for the database portion of Project 2. — Harrisburg city artists. We each took our chosen databases and edited them in Microsoft Excel, before plotting their locations in ArcGIS, using the addresses found in the 1900 Harrisburg Directory and the City Social Database. The result of my database and ArcGIS relation is the map to the right. Each of the bright green dots represents a city artist. There are fewer dots than there are names on my database and I believe this is partially due to some of these individuals being part of the same household. This could have also been caused by a couple addresses from the database not lining up properly with the map.
From this map, there really doesn’t seem to be a connection between these people, short of their profession. I was surprised and excited to find out that there were so many artists in 1900 Harrisburg — 21 to be exact. However, I am not overly surprised that they, for the most 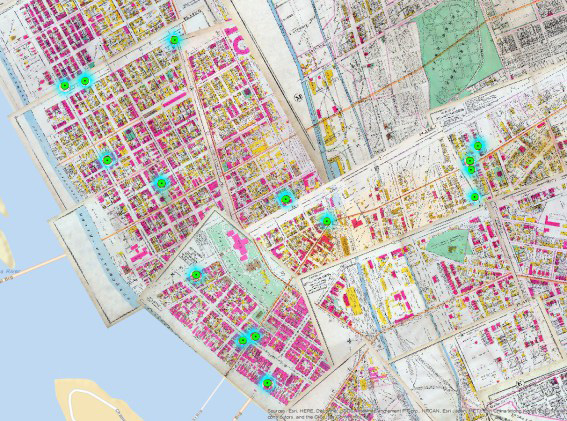 part, do not live close together, because many were running small businesses with their craft and, particularly in that time, it would not be an overly successful move to live very close to another artist. According to the Atlas map we placed on the modern map, most of these people lived along the west to east streets of the city, which could have made them and their work more visible to the public. Without any more information, however, I cannot make any more assumptions about these people. It is not immediately apparent that there are any other special comparisons I can make between these individuals.

For our third project, “City Spatial,” we’ll be focusing on a group of people that we researched in the Dauphin County Archives about halfway through the semester. We are responsible for finding a certain number of individuals and historical photographs of them. Then, we will chose locations with which they are associated, such as their residences or organizations/churches they were members of and build a story map to visually show the connection between these individuals and locations. We’ll then write up short bios about each person to include in the story. The goal of this project is for us to learn how to use story maps and to use a “geospatial approach to tell the stories of Harrisburg’s reforming citizens, institutions, and places between 1900 and 1930.” I will be focusing on 10 influential women and the impact they had on the city of Harrisburg during these years and look forward to learning more about these interesting ladies.
-Kaitlyn Coleman, Junior History and English Major at Messiah College
