In keeping with the theme of my course project, I will be looking into the statistics of Harrisburg veterans after they returned from war. In this, I will be comparing the marital status, school attendance, employment status, property owning status, and race. In conducting this, I utilized data from the 1930 census data.
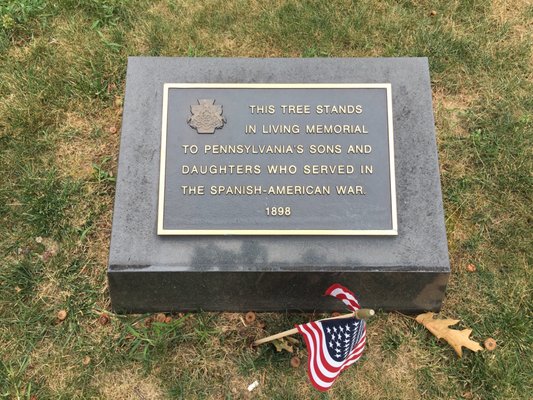
Photo depicts plaque dedicated to soldiers who fought in Spanish American War
As of 1930, there were 3,589 persons who had previously, or were currently serving in the military. Of those veterans, 2,889 of them served in World War I, 300 served in the Spanish American War, 267 did not serve actively in a war, 39 served as civilians, 19 served in the Mexican border conflict, 8 served in the American Philippine War, 34 served in 2 or more wars, and 31 could not be accounted for due to lack of information. (Note: assumptions had to be made for some of the information. These assumptions tally no greater than 50 personnel.) For the purpose of measuring the demographics, I will break down the World War I veterans, Spanish American War veterans, those who did not serve in a war, and those who served as civilians.
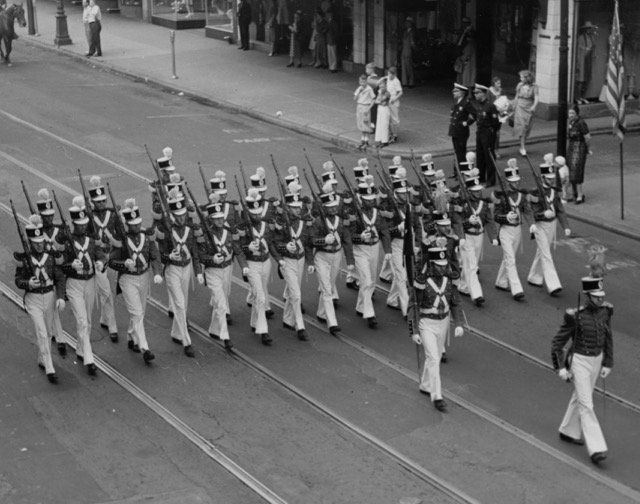
55th Pennsylvania Infantry, National Guard parade 1938
Of the World War I veterans living in Harrisburg, 2,183 (75.5%) were married, 592 (20.4%) were single, 47 (1.6%) were divorced, 51 (1.7%) were widowed, and 16 (.5%) had no marital status listed. Of the Spanish American War veterans, 242 (80%) were married, 24 (8%) were single, 23 (7.6%) were widowed, 8 (2.6%) were divorced, 3 (1%) had no recorded marital status. In total, there were 2725 (75.9%) married veterans, 677 (18.8%) single veterans, 105 (2.9%) widowed, and 61 (1.69%) divorced. Considering veterans of all wars collectively, 75.9% of the veterans were married, 18.8% were single, 2.9% were widowed, and 1.69% were divorced. Comparing this to Harrisburg’s population age 18 or older (n=58,705 residents): 65.2% (38,281) of the adult population was married, 23.4% (13785) was single, 9.9% (5,823) was widowed, and 1.3% (816) divorced. The other 179 (0.3%) had no marital status recorded. Looking at this data, it is surprising to see that the marriage rate for Harrisburg was at 65.2% compared to the 75.9% of veterans who were married. It was also interesting to see that the percentage of divorced residents was about equal among the soldiers and the rest of the residents as I had initially anticipated the divorce rate to be much higher within the group of soldiers.
When looking at the data for the school attendance, it was interesting to see that of the 3,589 veterans, 3,542 (98.6%) were literate and only 57 (1.5%) of them were illiterate. Of the 58,705 Harrisburg residents over the age of seventeen, 57,638 (98.1%) were literate and 879 (1.4%) were illiterate. There were 188 (0.3%) adults for whom literacy was not recorded. I was surprised to see that literacy rate was so high in 1930.
I also checked the employment status of the soldiers and Harrisburg residents but ran into a bit of a snag. When looking at the field recording employment (values were “yes” or “no”), there were only about 32,000 inputs, which I thought couldn’t be correct; so I checked again and saw that there were a few thousand data points missing from employment. I then adjusted the filter to look for “SalaryWage” as it consisted of a more complete data set and was able to record more inputs. For the soldiers, the employment rate was 97.2% (3,488) and unemployment rate 2.8% (101). This figure is low, considering that this census was taken in 1930, which was at the beginning of the Great Depression and the unemployment rate was at 8.7% nationally (by December). The employment in Harrisburg was 61.3% (36,020) out of 58,705 residents older than 17. I was surprised by the low unemployment among the veterans. I would like to see if that percentage changed as the Great Depression dragged on. I was not terribly surprised to see the that nearly half of Harrisburg’s general adult population was unemployed since my search included women as well. Women would have contributed to a higher unemployment figure given the frequency of women who stayed home at the time.
The property status was a surprising statistic to view. 42.4% (1,524) of the veterans rented, 26.9% (967) owned, and 30.5% (1098) neither owned nor rented and presumably lived with family. Of the total 80,394 Harrisburg residents, 10,166 (12.6%) Harrisburg residents owned, and 11,530 (14.3%) rented leaving 58,698 (73%) who lived with family or had no data recorded.
The race status was slightly unexpected. There were 3324 (92.6%) white soldiers, and 265 (7.3%) black soldiers. These percentages are proportional to the residents of Harrisburg with 73,898 (91.9%) being white, and 6,431 (8%) being black. I was surprised by how close these statistics were to the total population. I was expecting a higher percentage of white soldiers but was surprised to see that it was proportional to the populations.
In conclusion, the purpose of this was to see if there was a difference in marital status, school attendance, employment status, property owning status, and race between the Harrisburg residents and the soldiers. My hope was to see if the soldiers experience in war played an impact on their life after returning back to the city. I will be using this data to complete my final project which will focus primarily on the Spanish American War veterans and how they fared in life compared to the rest of the Harrisburg citizens.

One thought on “Harrisburg Veterans After Returning From War”