
From the 1900s to 1930s, Harrisburg underwent many transformations that affected its residents. The City Beautiful Movement was sweeping across the U.S. and was helped along in Harrisburg by the old capitol burning down and a push to move the state capital back to Philadelphia (Williams, 1). The destruction of the old eighth ward and the extension of the Capitol Park was also a major change in causing a demographic change in the city of Harrisburg. For my project, I am looking in part at which buildings were bought by the state and then destroyed to make room for the expansion. As Rachel Williams has recently mapped the migration of 100 families from the Old Eighth Ward to other parts of the city, I will be looking at a few examples of where people moved to trace the movement over time. We can use this database to see what changes occurred over time. Another useful tool is historic maps and GIS story maps so that we can show the movement easier in ways that we could not have before. Images can also be a useful tool to show how space has changed over time.
Over the time frame of a few years, 598 buildings on 30 acres of land were destroyed to make room for the Capitol Park extension (Beers, 18). The archival records tell us around what time these buildings were purchased by the state and then resold for demolition. Churches, businesses, and homes were all destroyed in this area to make room for the extension. Database records based on census records show us where in the Eighth Ward people were living before and after the ward’s demolition. When this is mapped out, we can get a picture of demographic changes over time and how people, the community, and businesses were impacted by these changes. We can also see other characteristics of these people using databases such as their marital status, occupation, and age.
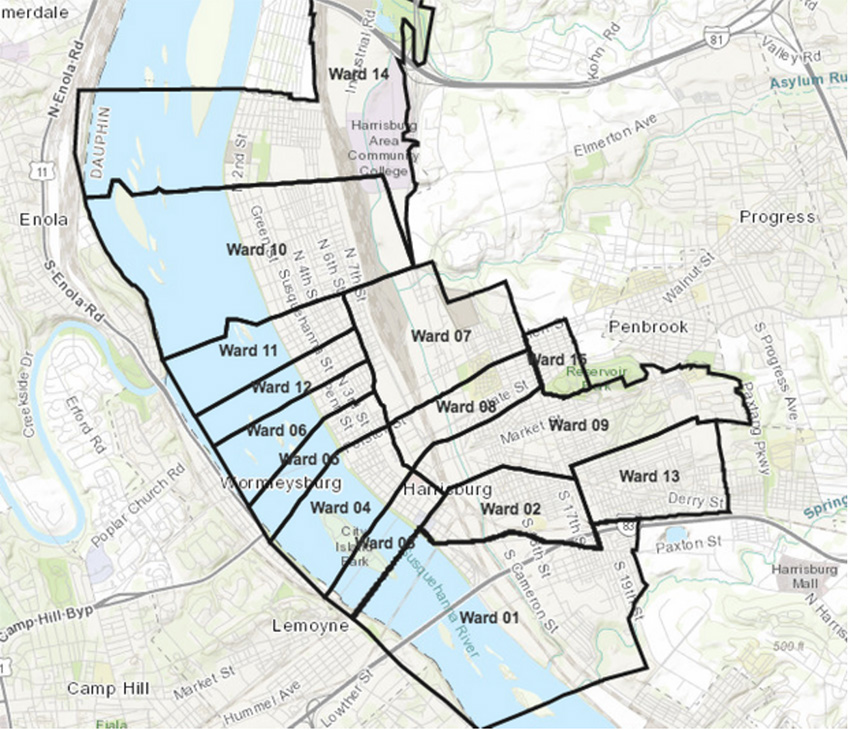
I was able to find a few examples of database records that tell us where people were living before and after the Capitol Park Extension took place. Many people moved to the nearby seventh ward once they had to move since it was physically closest to the eighth ward. We can see examples of where people went through families such as the Tate Family. In 1910 they were living at 509 South Street in a house that they rented. The head of the Family was Filmore Tate who was 48. He and his son George worked as a day laborer was could read and write. None of the rest of the family was listed as working. His wife Harriet was 45 and she and their 7 children living with them could also read and write. The census data in 1900 says she had had 16 children by 1900 but only 8 were alive. By 1910, more of them had jobs and several of them worked in hotels and form private families. By 1920, Filmore Tate had died, they had moved to the seventh ward, and most of their children had moved out. Another family, the Lewis family, was living on Angel Street in the Eighth ward but moved to North fourth street in the sixth ward. They also rented their home and were literate. Charles Crampton, who is one of the 100 Voices, lived in the eighth ward and was an important member of the community but had to move to the seventh after the destruction of the eighth. He was a doctor and deputy secretary of health in Harrisburg. These are just a few examples of this demographic shift that occurred and changed Harrisburg during this time period. This ability to trace these movements has expanded over the previous years with GIS and we can explore historical events in ways that we could not explore them in the past (Weller, 25). By allowing us to visually see what happened it helps us to understand the past more than just reading about it in a book.
In addition to being able to trace movement, images can help us get a better idea of what it looked before and after added to GIS technology. For example, we have pictures of statues sculpted by George Barnard that were placed outside the Capitol Building in 1911. We can also view pictures Churches like the Wesley Union A.M.E. Zion Church and St. Lawrence Catholic Church before and after their moves. These pictures can help us visualize and understand the changes that took place more extensively. One of my friends had visited the Capitol Complex a month or so ago and took pictures for our darkroom photography class. The pictures she took of St. Lawrence Catholic church helped make it seem more real for me that this is an actual church in this area that was forced to move and not just a random building I saw mentioned in the archival record. We also have many other pictures of the eighth ward that can be used to help us get a mental image of what this space looked like. The combination of databases, GIS technology, and story maps, and pictures can help people build connections and learn more about historical events than in the past.
